Showing posts with label Promap. Show all posts

Wednesday, 5 November 2014

Promap Masterclass - Article 12

This Masterclass deals with historical mapping. We currently have the largest database in existence of OS Historical mapping and it is accessible via Promap.


Where to obtain your Historical mapping in Promap


Historical maps in Promap can be ordered as either individual maps or as a variety of map packs.
  • Individual Maps – These can be ordered using the Historic maps tab at the left hand side of the screen, the maps will be displayed in the date order in which they were published.
  • Historic Map Pack (Including Historical Aerial Photography) – This comprises the 1:2500 and 1:10,000 maps available for your site and also Historical town plans, historical building plans, Russian military mapping and Historic Aerial Photography, they  can be ordered by using either the historic map tab on the left hand side of the screen or through the reports ordering process
  • Historic Map Packs at 1:2,500 and 1:10,000 (excluding Historic Aerial Photography) – These options are available via the Export data section at the left hand side of the screen.


NOTE: Historic Aerial Photography can also be ordered from the Export data section under the category Aerial Photography as a separate dataset. 

Ensuring the best possible coverage for your individual historical maps


To ensure get the best possible coverage on your individual historic maps, use the coverage column and the preview option to ensure it covers the area of the map you are interested in.

For more detailed advice on Promap why not book one of our training courses (which are all now FREE) or visit our training website by clicking here to find other useful tips and training aids.

If there are any other topics you would like to see included in the Masterclass blogs or if you have any other questions please call us on 0844 844 9965 or email us at training@promap.co.uk

Wednesday, 29 October 2014

Promap Masterclass - Article 11

This instalment of our Promap Masterclass articles looks at ordering reports from Promap. This process follows the common style of online purchasing:

  • Select your product
  • Add it to your shopping basket
  • Confirm your delivery details
  • Checkout at the end

Whilst this is a fairly simple process there are a couple of features which can assist with this.

The Promap Masterclass is run in conjunction with our free Promap Masterclass webinars, which demonstrate the features in action.  To register for the next free webinar click here.

Use the free to view layers to order your reports


When ordering your reports from Promap, define the area you want for your report using one of the free to view layers, such as VML Raster, to avoid an unnecessary viewing charge.

Editing the address for your report


To ensure the correct address for your site is shown on your report use the edit option on the left hand side of the reports section to alter it as required.

Tracking and re-downloading your reports


To locate your report and track its progress, click on the Order tracking option under Reports to access a number of different search options.

Once you have located your report, re-download it using the following steps:
  • Click on the orange plus sign to the left of the order date to view the details of the report.
  • Select the “Retrieve this file” option from the right hand side of the screen
  • This will now add the report to the download manager section of Promap which can be located under the “Export data” tab on the left hand side of the screen.

Where to obtain sample data and reports


There are a variety of methods within Promap for obtaining information about our data or accessing samples reports.  Some of these are listed below:

  • Click on the “Maps & Data” option on the Promap login screen to view details of all the datasets and reports contained in Promap.  You can also view samples in a variety of formats.
  • To access samples of our reports follow the process for ordering site reports. Then on the “Product Selection”  screen select the option under the product name for “More info and samples”
  • To obtain information about the datasets in Promap Export hover over the orange ‘I’ button to the right of each dataset to display a dialogue box 

For more detailed advice on Promap why not book one of our training courses (which are all now FREE) or visit our training website by clicking here to find other useful tips and training aids.

If there are any other topics you would like to see included in the Masterclass blogs or if you have any other questions please call us on 0844 844 9965 or email us at training@promap.co.uk

Friday, 24 October 2014

Promap Masterclass - Article 10

This week we deal with exporting data from Promap.

The Promap Masterclass is run in conjunction with our free Promap Masterclass webinars, which demonstrate the features in action.  To register for the next free webinar click here.

Using the free to view layers to export OS Detail Data


To avoid an unnecessary viewing charge when exporting OS Detail data from Promap:
  • Define the area you want to export using one of the free to view layers i.e VML Raster
  • When you are at the stage of selecting your datasets choose the OS Detail layer from the options.
Defining your export site using the shape tool


To avoid unnecessary time cropping your data and to keep costs down, you can more accurately define the area you are looking to export by using “Set shape frame” in “Step 1 options” under Export Data. This activates the shape tools which enable you to accurately define the site, this way you only export and pay for the data you want.

New datasets and dataset information 


  • Any new datasets that have been added to Promap are now displayed under the “Current Mapping and New Data” category. Promap will automatically take you here once you have defined your site and clicked on the “Get export data” tab under the export options.
  • Hover over the orange ‘I’ button next to the listed datasets to view dataset details, including delivery times and available formats.
Download Notification       


The delivery time of some datasets, such as our bespoke range, is slightly longer. To relieve you from having to log in to Promap to check the data availability, we’ve included the option “Email me when my files are ready to download”.  Select this option and confirm your email address to receive an email notification.

If you found this Masterclass useful, keep an eye out for the next one. For more detailed advice on Promap why not book one of our training courses (which are all now FREE) or visit our training website by clicking here to find other useful tips and training aids.

If there are any other topics you would like to see included in the Masterclass blogs or if you have any other questions please call us on 0844 844 9965 or email us at training@promap.co.uk

Tuesday, 21 October 2014

Wildfire TV takes a walk through history with Landmark

 Walking Through History - Channel 4

Television production company, Wildfire Television has selected Landmark Information Group to source and supply a range of data terrain images for a series commissioned by Channel 4.

WalkingThrough History’ is the third series of six history documentaries that are presented by Sir Tony Robinson.   The programmes start broadcasting  on Saturday 25th October at 20:00hrs on Channel 4 and will focus on locations across the UK, including the Cairngorms, Sherwood Forest, Pembrokeshire, the Yorkshire Moors, and the Channel Islands.

Landmark has worked closely with the production team to produce a series of images showing stylised terrain data overlaid with reference features including key road networks and coastlines.  This has been produced using a combination of Ordnance Survey open data and OS Terrain® 50 datasets.

Marisa Verazzo, Production Manager of Walking Through History for Wildfire Television said: “We are pleased to be working with the team at Landmark Information Group to provide us with a host of contoured terrain maps for Walking Through History.  The maps really put the areas that we will be focusing on in the series into context, and by working with Landmark we have been able to access exactly what we need.”

Matt Wills, Senior GIS Analyst at Landmark Information Group said: “We are pleased to be able to deliver a host of hill-shaded and coloured OS Terrain 50 maps to Wildfire Television for use in the new Channel 4 documentary.  It just goes to show another great way that our extensive range of datasets and maps are being put to use in the commercial world – so, as well as supporting the environmental, land and property industries, our data and mapping tools are also here to support media, marketing and other similar industries in piecing together the history of a given location.

Monday, 13 October 2014

Landmark Information Group introduces new Licence Management Service to digital mapping products

We've introduced a new Licence Management functionality to the Promap digital mapping platform. The service makes it easier to renew export data licences in accordance with Ordnance Survey regulations, as well as viewing and managing licences online. 

The new Licence Management tool is designed to support clients in ensuring all export data purchased from our Promap service fully complies with Ordnance Survey terms and conditions, avoiding any penalties for expired or incorrect licences.

Carole Ankers, Product Development Director at Landmark Information Group said: “The introduction of Licence Management is one of our latest product enhancements and is designed to support our customers in keeping all data in licence.  It makes it easy to renew digital data export licences and centrally manage them in one single place. It also helps keep users notified of when a licence is about to expire so a renewal can be organised.”

Nick Macready, Strategic Partner Manager from Ordnance Survey: “We encourage the use and exploitation of mapping and data by providing a wide range of licences that focus on how customers wish to use our information and the rights we grant for those uses.   We have a series of licences, which underpin the rights being granted for use of Ordnance Survey products.  By implementing the new Licence Management tool in Promap, Landmark ensures its customers can benefit from the most current version and also fully comply with the correct licence for the mapping and data that each customer accesses via the service, and we applaud them for supporting our drive to clampdown on un-licenced data.”

For more information on Promap, telephone 0844 844 9960 or visit www.promap.co.uk.    

Wednesday, 8 October 2014

Promap Masterclass - Article 9

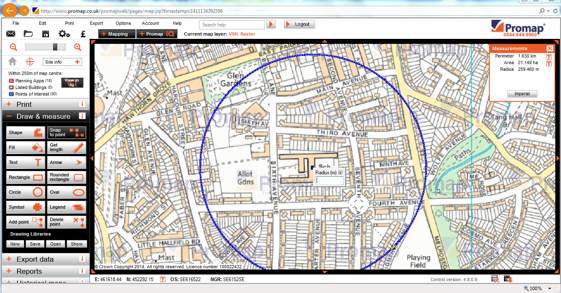
The ninth instalment of our Promap Masterclass blogs looks at Promap IQ, which enables you to obtain planning application, listed building and points of interest information for your site and the surrounding area.

These blog articles are run in conjunction with our free Masterclass webinars, which demonstrate the features in action.  To register for the next free webinar click here.


Accessing Promap IQ


 To access Promap IQ:
  • Open the map of your site
  •  Click on either the Promap IQ tab above the top left hand corner of the map or the Promap IQ teaser box on the left hand side of the screen.


The teaser box will appear on the  “Street” , “VML Raster”, “Aerial” , “OS Detail” or “UKMap Detail” (for sites in London) layers for your site and shows how many planning applications, listed buildings and points of interest you have within 250m of the site.


Promap IQ – Filters Screen


The filters screen enables you to specify what information Promap IQ will display. Your options are:
  • Search Radius –select a search area anything from 50m to 5km
  • Planning Applications –select applications based on category, date (as far back as 1997), type or size. You can remove all the planning applications with an estimated project value under £100,000 by unticking this last option
  • Listed Buildings – These can be selected by the following grades:
    • Grade 1
    • Grade 2*
    • Grade 2
  • Points of Interest – These can be selected by category.  There is also an option to edit each category for the information you need. Points of Interest data enables you to view the social infrastructure for an area i.e. doctors, surgeries, dentists, schools etc.

Note 1: The 500 search results provided by Promap IQ for each of the three categories are the 500 nearest rather than the 500 newest.

Note 2: Listed buildings will not appear for Scotland and Wales.  This data is only available for England.

Note 3: All the data in Promap IQ is updated on a regular basis to ensure accuracy. The update cycles are:
  • Planning Applications – 6 Weeks
  • Listed Buildings - Annually
  • Points of Interest – 6 Months  


Your search results are then displayed on the map via icons, the key for which can be found under the “Spot Legend” at the top of the screen. 


Promap IQ – Detailed Information


Once you have paid the charge to view the detailed information you will be taken to the above screen.  You can use the “Detailed Information” section on this screen to view the following:
  • High level information about planning applications. You are able to copy the application ID number to a clipboard and use the provided link to the local authority website where you can paste the ID number and view the full application.   
  • Detailed information about listed buildings using the Listed Buildings information, which enables you to access English Heritage’s website “Images of England”.
  • Points of interest will give you high level information on all of the results in the area.

The local plan tab in the top right hand corner of the screen will display links if you wish to access the local plan or local development framework.

At this stage, you have the opportunity to purchase the information in PDF or spreadsheet format (the spreadsheet can also be selected with geo-coordinates for more accurate positioning of information).
  
If you found this Masterclass useful, keep an eye out for our next Masterclass blog. For more detailed advice on Promap why not book one of our training courses (which are all now FREE) or visit our training website by clicking here to find other useful tips and training aids.

If there are any other topics you would like to see included in the Masterclass blogs or if you have any other questions please call us on 0844 844 9965 or email us at training@promap.co.uk

Wednesday, 1 October 2014

Promap Masterclass - Article 8

This articles looks at more advanced customisation tools available to you in Promap. The tools in this section are all accessed by right clicking on your selected shape to display an advanced drawing tools menu. The tools available are:
  • Cloning Shapes
  • Grouping Shapes
  •  Aligning Shapes
  •  Spacing Shapes
  •  Drawing Libraries
These blog articles are run in conjunction with our free Masterclass webinars, which demonstrate the features in action.  To register for the next free webinar click here.


Cloning Shapes 


To duplicate shapes in Promap, rather than re- drawing or copying and pasting them right click on your selected object and select the clone option from the drop down menu that appears.


Grouping Shapes within Promap


When working with multiple objects within Promap the ability to group objects can be very useful. To select the items that you want to group either:
  •  Hold down the CTRL key and left click on each of the items you want to select; or
  •  Hold down the SHIFT key and the left click button on the mouse and create an outline around all the items you want to select.
Once the items are selected right click on your mouse to bring up the advanced drawing tools drop down box and select group from the options. 


Aligning and Spacing shape


To align or space shapes on your map:
  •  Select the two objects (using either of the two methods mentioned under “Grouping shapes” above) and right click on them
  • Instead of grouping them select the “Sizing and Shaping Option” to align, size or space the shapes.  

Drawing libraries


Rather than creating the same shapes on your maps repeatedly, save the shape in a drawing library

To save your shape to the drawing library:
·         Draw the shape
·         Right click on the shape
·         Select “Special”
·         Click on “Add to drawing library”

When the shape is next required:
·         Open the relevant library
·         Drag and drop the shape to the required location on the map

Use the Drawing Libraries options at the bottom of the “Draw and Measure Section” to create a new drawing library, save a drawing library, open a previously saved drawing library or show your currently selected drawing library.

NOTE: Drawing libraries can only be used on the map layer where they were created i.e. a drawing library created on the OS detail layer can only be used on OS detail maps.
 
If you found this Masterclass useful, keep an eye out for our next Masterclass blog which is due to be sent on the 8th October 2014 . For more detailed advice on Promap why not book one of our training courses (which are all now FREE) or visit our training website by clicking here to find other useful tips and training aids.

Wednesday, 24 September 2014

Promap Masterclass- Article 7

The seventh in our Promap Masterclass blogs is the first of two looking at the more advanced customisation tools available to you in Promap.

These blog articles are run in conjunction with our free Masterclass webinars, which demonstrate the features in action.  To register for the next free webinar click here.


Multiple Point Selection


When outlining or measuring a curve using Snap to Point you can join up multiple white dots more quickly using the space bar. Instead of clicking on each dot around the curve, click on the first white dot then hold down the space bar and click on the last white dot.

NOTE : because the orange and white dots on your outline come from different databases, if you have an orange dot along the curve you will have to click to that first , then to the next white dot to use this curve shortcut   

Selecting Drawn items


If you are having problems selecting items you have created on the screen then use the following options :

N Key – Pressing N on the keyboard will tab forward throught the customisation you have added in the order it was created.

P Key – Pressing P on the keyboard will tab backward throught the customisation you have added in the order it was created.


Setting Lengths, Angles and Radius


The following tools will allow you to more accurately create shapes on your map:

L Key- Pressing L whilst using the Sshape tool allows you to fix the lngth of the line.

A Key – Pressing A whilst using the Shape tool allows you to fix the angles for your shape

R Key – Pressing R whilst using the circle tool allows you to fix the radius for your circle

  
If you found this Masterclass useful, keep an eye out for our next Masterclass blog which is due to be sent on the 1st October 2014 . For more detailed advice on Promap why not book one of our training courses (which are all now FREE) or visit our training website by clicking here to find other useful tips and training aids.

If there are any other topics you would like to see included in the Masterclass blogs or if you have any other questions please call us on 0844 844 9965 or email us at training@promap.co.uk

Tuesday, 16 September 2014

Landmark welcomes PAS 128 specification to standardise underground utility detection, verification and location

The new Specification for Underground Utility Detection, Verification and Location has been introduced to provide consistent and clear best practice in detecting underground utilities. 

The specification, which the British Standards Institution has termed PAS 128:2014, aims to set clear provisions for those operating in this space and will ultimately lead to more effective planning and safer execution of ground/civil works, street excavations and utility-based activities.

With no agreed or published UK standards related to the detection, verification or location of underground services, PAS 128 aims to provide clarity in the service provided and methods employed, as well as consistency in the approach to data capture

As part of PAS 128, four levels of survey types have been defined: (survey type D) desktop utility records search, whereby utilities are identified through the analysis of paper and digital records or reports, such as those available from Landmark; (survey type C) site reconnaissance, where existing records are validated by the visual inspection of physical evidence observed during a site visit; (survey type B) detection, where utilities are detected using geophysical techniques; and (survey type A) verification, where underground services are located via a manhole, inspection chamber or through excavation.

Piers Edgell, Senior Account Manager at Landmark Information Group said: “With no formal standardisation in place for the detection, verification or location of underground utilities, we fully welcome PAS 128 and encourage our customers that operate in the construction, engineering and built environment sector to contact the BSI to obtain a copy of the standard. The desktop utility search reports from Landmark form the basis of the detection process outlined in PAS 128, and we would be happy to talk through how the data can help you achieve a PAS compliant survey. By doing so, it will help avoid possible project delays, injuries or service disruption by having access to the very latest utility data at the outset.”

To access a copy of the BSI PAS 128:2014 report, click here.

Otherwise, for more information about the Utilities Report available from Landmark, telephone 0844 844 9952, email customerservice@envirocheck.co.uk or visit www.envirocheck.co.uk/products/utilities/utilities_report/

Thursday, 11 September 2014

A Race Through Time

As I watched Mo Farah power his way from Newcastle, through Gateshead and ultimately cross the finish line in the coastal town of South Shields at this weekend’s Bupa Great North Run, it made me wonder how the area has changed over the years. 

The region has seen rapid development in recent times, moving away from its industrialised past, and the regeneration of the area is clear to see as we watched the runners make their way along the half marathon route.   I’m sure that if the same route was followed 50 years, 100 years or even further back in time, the runners would have certainly seen a completely different ‘north east’ from what we see today.

Starting in Newcastle, the course takes in the iconic Tyne Bridge which was opened in 1928.  As runners descend down the A167(M), historic maps show us that a reservoir was located on the exact same spot as the route back in 1864 – a swimming costume would certainly have been needed for this leg of the route. 
1864 OS map and Open Street Mapping
Dodge a reservoir

Carry further along and runners may have had to hold their noses back in 1864, as the Corporation Manure Depot was located en route.   Residential housing would have made the route impassable, with Alma Street residences located on what is today the main route towards Gateshead. 

1864 OS map and Open Street Mapping
Alma Street residences would make this impassable

The main ‘Newbridge’ station was located in what today is a motorway out of the city, and this was surrounded by coal depots, unstable ground and yet more residences, which has since made way to accommodate for the main arterial route around the city.

As the runners continue through the route, approaching South Shields on the A1300, it would have become a much more ‘cross country’ affair, as much of the surrounding areas were simply farmer’s fields.   A view towards Simonside Hall would have been clearly visible – according to reports, this was the seat of Robert Wallis who opened the first shipyard in South Shields in about 1720. After his death, his second son John developed Simonside Hall in 1784, which had fine views of Jarrow Slake.  South Shields A.F.C took a lease on the estate in 1947, and the main block of the Hall was eventually demolished in about 1973 – today the site is made up of residential housing.

As we approach the finish line in South Shields on the coastal A183 road, the ‘cross county’ theme would have continued back in the 1800’s.  There were virtually no roads in place in 1858, and instead the area consisted of marsh land, quarry land, tracks and wells.

The Great North Run route would certainly have been difficult, in fact near impossible, back in the history books and it really helps to demonstrate just how the lay of the land, industry and urban development has really changed in the last century.

Andy Noble
Head of Data
Landmark Information Group

Images: Ordnance Survey © Crown copyright and/or Database Right. All rights reserved. Licence 100022432