Tuesday 30 September 2014

Jess Varnish challenges Landmark staff to jump on their bike and get DNAFit


Landmark Information Group has become the first company in the world to offer genetically guided corporate wellness programmes to help staff manage their diet and boost their fitness.

Landmark has teamed up with British Olympian and double Commonwealth 2014 Games Medal winning cyclist Jess Varnish and British nutrigenetics firm DNAFit Life Sciences to offer DNAFit, a test which reveals the best workout and diet to help weight loss and improve wellness.

Jess has used the DNAFit test to refine her training and 50 staff at Landmark have followed suit, including CEO Mark Milner. All will receive their own bespoke DNAFit diet, nutrition and exercise plans to help change their lives.

They will also have the chance to turn science fact into pedal power in Landmark’s Bike Week ‘JESS’S JOGLE’ challenge - to ‘virtually’ cycle the distance from John OGroats to Land’s End (955 miles).

Exercise bikes allowing all staff to take up the challenge will be located at Landmark’s offices in Brighton, Exeter and Reading. Participating staff are also helping to raise money for Cycling Projects, which promotes accessible cycling nationwide. All staff will also be invited to attend genetic workshops hosted by DNAFit Consultant and athlete Andrew Steele, who used the programme as part of his training for the British Olympics men’s 400m.

Landmark’s health and wellbeing initiative comes at a time when the NHS has raised concerns that obesity is causing millions to suffer life-long illness. NHS Chief Executive Simon Stevens will publish plans next month to encourage private companies to help staff lose weight by holding slimming classes, running clubs and promote cycling.

At Landmark, we are already powering ahead by promoting healthy lifestyles through a range of initiatives, like JESS’S JOGLE challenge,” said Landmark’s CTO, Ian Clarke.  “A healthy employee is a productive employee. DNAFit enables staff to know the very best diet for their own genetics and train according to their unique genetic makeup, in the process influencing behavioural change and creating motivation.

The revolutionary DNAFit test – which made news around the world when it was revealed it was being used by English Premier League soccer teams and Olympic athletes – scans up to 45 gene variants linked to a body’s capacity to cope with training and food. The tests reveals if a person is best suited to endurance exercise (heavy cardio) or power exercise (weights and sprints), how much recovery time is needed between training and the risk of soft tissue damage.

In a recent study of 191 obese people by the University of Trieste, those using a DNA-matched diet lost 33 per cent more weight than those counting calories. The DNAFit test also reveals a person’s carbohydrate and saturated fat sensitivity, lactose and gluten intolerance risk, as well as their ideal diet, detox ability, anti-oxidant needs, vitamin and micronutrient intake, salt and caffeine sensitivity.

Jess Varnish said: “I think it’s excellent that Landmark is the first to offer this test to its staff. It’s really important to me to promote positive values around overall fitness, health and wellbeing. As Landmark’s ambassador I’m really excited to see how they are embedding this approach as part of their own internal ethos.

DNAFit’s founder Avi Lasarow added: “We’re delighted Landmark has become the first firm to offer genetic testing for its staff.  They will now be able to train and eat smarter, confident that they have a workout and diet that is personalised.”

For more information visit www.landmarkbikeweek.co.uk and follow Landmark’s Twitter account @LandmarkUK #blazeatrail.

To support the week and make a donation to Cycle Projects, please visit the JustGiving page at: https://www.justgiving.com/landmarkbikeweek/

Friday 26 September 2014

Match Report: - Landmark Reading vs Landmark Exeter Eagles


MATCH REPORT: 

This Autumn has seen the official kick-off of a brand new inter-company football tournament here at Landmark.  In the first leg of two matches, the Landmark Exeter Eagles travelled to Reading for the first recorded Landmark vs Landmark 11-a-side football match. The teams met at the Madjeski Academy and despite the pending battle, banter and camaraderie were warmly shared.

With new kits donned, the teams stepped out to play what was a tight, combative match with both sides showing class and with swings in play and possession. The Eagles showed no sign of fatigue from the extended travel but it was Reading who took early control of the game, with pressing midfield play. The Eagles defence held a deep line and with diligent holding midfield play, coolly preventing any real chances on goal. 

Following the first 20 minutes, territory regained, the Eagles took more control of the middle of the park and spraying a wide ball out left, Alex Ridley received the ball on the touchline, posing no apparent threat. With graceful control, Alex cut inside and drove across the edge of the 18-yard box, skipping one, then another full-blooded challenge. Paul Marshall, the Referee, professionally signalled play-on and with single-minded focus on goal Alex whipped a curling ball, with his off right leg. The ball clearly going wide inexorably drew in and snuck past the keeper into the bottom right (despite the full stretched diving efforts of Simon Dungey). The Eagles kept the score 1-0 going into the half-time interval​.

The second half continued with the same high energy and desire. Both teams were giving 100%, but with the home advantage telling and Reading pressing high more threats ensued. Sam Francis (Man of the Match) tore down the left flank harrying the Eagles back line but was frustrated through excellent tight defence, in particular by Tim Hutton, who again had an outstanding performance in Right Back. Undeterred, the Reading Tsunami continued and finally broke the dam on 56 minutes. Darting in behind the defence, Sam picked up a threaded through ball on the edge of the 18-yard box and stabbed it into the goal for the equaliser.

Parity was again established and the Eagles looked likely to hold to a draw, but on 79 minutes, ghosting in between the midfield and defensive lines, Steve Sanashee, controlled the ball and lashed it from 25-yards. The ball fizzed and moved through the air, Martyn Lufkin got his fingertips to it sending the ball onto the underside of the crossbar. The ball smashed down onto the goal line and then up into the roof of the net, for a final score of Reading 2 – Exeter 1, after the first leg.

The game was played with a fantastic spirit and showed the true nature of Landmarkers – striving to do the best, giving your all, showing pride in the colours!

Squad Lists

Referee: Paul Marshall

Landmark Reading
Landmark Exeter Eagles
Simon Dungey
Michael H
Jay Cardona – Martin (C)
Nick Mills
Kieran Steward
Steve Sanashee (79)
Farouq Sulaiman
Sam Francis (56)
Gregory King
Matt Bingham
Imran Zaman
Miranda Pont
David Paler
Charlie Ford
Ryan Wicks
Martyn Lufkin
Tim Hutton
Andrew D’Urban-Jackson
Matthew Smith
Andrew Rose
Aaron Smallshaw (C)
Steve Huxtable
Chris Gaunt
Alex Ridley (34)
Ryan Parsons
Richard Forbes
Chris Barnett
Darwin Lee

Match Report by Aaron Smallshaw
Deferred Jaffa Cake Distributor and Programme Manager
Landmark Information Group

Thursday 25 September 2014

Dataset Focus: Agency and Hydrological

Today's focus is on our archive of Agency and Hydrological data, which is designed to establish the risk of flooding and hydrological contamination to your site.  

Click here to access the further information


Wednesday 24 September 2014

Promap Masterclass- Article 7

The seventh in our Promap Masterclass blogs is the first of two looking at the more advanced customisation tools available to you in Promap.

These blog articles are run in conjunction with our free Masterclass webinars, which demonstrate the features in action.  To register for the next free webinar click here.


Multiple Point Selection


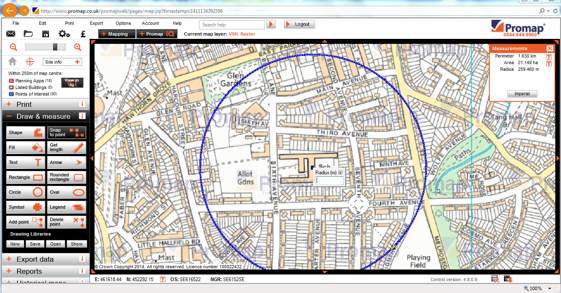
When outlining or measuring a curve using Snap to Point you can join up multiple white dots more quickly using the space bar. Instead of clicking on each dot around the curve, click on the first white dot then hold down the space bar and click on the last white dot.

NOTE : because the orange and white dots on your outline come from different databases, if you have an orange dot along the curve you will have to click to that first , then to the next white dot to use this curve shortcut   

Selecting Drawn items


If you are having problems selecting items you have created on the screen then use the following options :

N Key – Pressing N on the keyboard will tab forward throught the customisation you have added in the order it was created.

P Key – Pressing P on the keyboard will tab backward throught the customisation you have added in the order it was created.


Setting Lengths, Angles and Radius


The following tools will allow you to more accurately create shapes on your map:

L Key- Pressing L whilst using the Sshape tool allows you to fix the lngth of the line.

A Key – Pressing A whilst using the Shape tool allows you to fix the angles for your shape

R Key – Pressing R whilst using the circle tool allows you to fix the radius for your circle

  
If you found this Masterclass useful, keep an eye out for our next Masterclass blog which is due to be sent on the 1st October 2014 . For more detailed advice on Promap why not book one of our training courses (which are all now FREE) or visit our training website by clicking here to find other useful tips and training aids.

If there are any other topics you would like to see included in the Masterclass blogs or if you have any other questions please call us on 0844 844 9965 or email us at training@promap.co.uk

Santander incorporates environmental data from Landmark Quest into mortgage valuation assessment process

Latest news from our 'Landmark Quest' division:

"Landmark Quest, a leading provider of risk management, mobile solutions and bespoke valuation software for lenders and surveyors, has today announced it has partnered with Santander to integrate environmental risk data into the lender’s mortgage valuation process.  It is the first high street bank to assess environmental data, in order to support its overall decision-making process.

With Santander opting to use Automated Valuation Models (AVMs) alongside physical valuations for property purchases and remortgages, the environmental data helps support the AVM decision by highlighting risks such as flooding and subsidence. Should either the AVM or the environmental data highlight a risk or not be sufficient to support a decision, rather than cases being declined they will be forwarded to a specialist valuation surveyor to undertake a physical inspection.

David House, Head of Property Risk at Santander UK said: “We have partnered with Landmark Quest to integrate environmental data into our AVM. By incorporating this, Santander is taking a robust approach to property risk by looking at factors other than just the valuation. If any environmental risk is highlighted, we will revert to our usual physical inspection process. This ensures that none of our customers will be disadvantaged as a result.”

Adds Peter Stimson, Managing Director – Landmark Quest, Landmark Information Group: “Landmark’s database is one of the largest of its kind in Europe holding approximately one billion active features.  By working in partnership with Santander, we are proud to integrate environmental data into its valuation process so any potential risks can be analysed as part of the lender’s already thorough analysis.”


Thursday 18 September 2014

Uncovering the Past: Stonehenge

It’s been interesting to watch recent reports regarding Stonehenge and, in particular, the discovery of 17 more significant sites that are linked to the ancient plot.

Over recent years, scientists from Birmingham University have been using technology to map the area and it is from this that the new shrines and burial mounds have been discovered.

Stonehenge is believed to be over 5,000 years old. While Landmark’s comprehensive collection of historical mapping does not reach back quite that far, our interest has been piqued by the use of LiDAR and laser scanning techniques to produce detailed terrain models, in addition to the way GIS has been used to overlay archaeological finds to analyse the site. All of which are very similar to the processes used today by our customers in the surveying, planning, environmental and construction industries.

Simply substitute burial mounds, solstice markers and druid procession routes with planning applications, contaminated land and environmental consultants, and hey presto!

From watching the developments at Stonehenge, it’s clear that today we are fortunate to have access to highly advanced mapping data and technologies that enable us to learn far more about our past than ever before.  And, from our customer’s point of view, having access to information regarding a piece of land’s former use can ultimately help shape the way the very same piece of land is used in the future.

Piers Edgell, Senior Account Manager and Matt Wills, Senior GIS Analyst, Landmark Information Group

Appendix:


Wednesday 17 September 2014

Is Fracking the Future?

The issue of fracking has received a huge amount of media attention and coverage in recent weeks and continues to divide the nation’s opinion. The process, which involves drilling into shale rock and pumping water, sand and chemicals into the ground, is opposed by many due to its supposed links with contamination of groundwater, pollution of air by leaking methane and seismic activity.  According to an independent government-commissioned report, two minor earthquakes in Blackpool back in 2011 were attributable to fracking, and this has served to antagonise opponents to fracking in the UK further.  

However, despite these concerns many others continue to advocate the process of fracking, claiming it to be a relatively robust and cost effective way of extracting natural fuel from the ground. The UK government continues to urge the country to ‘get behind fracking’ in a bid to ensure energy self-sufficiency for future decades.


So, how exactly does fracking work? At the most simplistic level, a mixture of water, sand and chemicals is pumped into ground. The subterranean rock then fractures under the increased pressure, allowing trapped gas to be released. The gas is then collected on the surface. The idea is not a new one and has existed in the US since the 1970s, yet has only recently been put into significant production due to technological advancements. As well as the UK, many other countries have also recently given fracking ventures permission to begin drilling in the search for the much-needed fuel we need to make our society function.

It appears that whichever technique is used, extracting fossil fuels from the land will always remain a contentious topic. Although we already have a number of current or approved fracking sites across Kent, Sussex, Staffordshire, Lancashire, Cheshire, Scotland and South Wales, as well as more in the pipeline, the future of fracking in the UK still remains uncertain. The South Downs National Park Authority recently successfully rejected drilling plans, so the presence of natural gas does not in itself point to the development of an imminent fracking site.

However, the unavoidable fact of the matter is that the need for an independent energy-supply is ever-increasing, particularly with fears growing of a Russian gas switch-off. Certainly, more research is needed to make fracking cleaner and safer and serious attention should once again be given to the development of new ways to harness renewable sources of energy.

Landmark Information Group’s Energy and Infrastructure report provides information on existing and planned energy developments, for further information email: helpdesk@landmark.co.uk


Author: Ben Furlong, Senior Consultant, Argyll Environmental

Tuesday 16 September 2014

Landmark welcomes PAS 128 specification to standardise underground utility detection, verification and location

The new Specification for Underground Utility Detection, Verification and Location has been introduced to provide consistent and clear best practice in detecting underground utilities. 

The specification, which the British Standards Institution has termed PAS 128:2014, aims to set clear provisions for those operating in this space and will ultimately lead to more effective planning and safer execution of ground/civil works, street excavations and utility-based activities.

With no agreed or published UK standards related to the detection, verification or location of underground services, PAS 128 aims to provide clarity in the service provided and methods employed, as well as consistency in the approach to data capture

As part of PAS 128, four levels of survey types have been defined: (survey type D) desktop utility records search, whereby utilities are identified through the analysis of paper and digital records or reports, such as those available from Landmark; (survey type C) site reconnaissance, where existing records are validated by the visual inspection of physical evidence observed during a site visit; (survey type B) detection, where utilities are detected using geophysical techniques; and (survey type A) verification, where underground services are located via a manhole, inspection chamber or through excavation.

Piers Edgell, Senior Account Manager at Landmark Information Group said: “With no formal standardisation in place for the detection, verification or location of underground utilities, we fully welcome PAS 128 and encourage our customers that operate in the construction, engineering and built environment sector to contact the BSI to obtain a copy of the standard. The desktop utility search reports from Landmark form the basis of the detection process outlined in PAS 128, and we would be happy to talk through how the data can help you achieve a PAS compliant survey. By doing so, it will help avoid possible project delays, injuries or service disruption by having access to the very latest utility data at the outset.”

To access a copy of the BSI PAS 128:2014 report, click here.

Otherwise, for more information about the Utilities Report available from Landmark, telephone 0844 844 9952, email customerservice@envirocheck.co.uk or visit www.envirocheck.co.uk/products/utilities/utilities_report/

Monday 15 September 2014

Nipping Buy-to-Let Fraud in the Bud

In the September 2014 edition of Mortgage Finance Gazette, Jayne Coppinger,  Sales & Relationship Manager of Landmark Quest provided her expert view on Buy-to-Let fraud:
Jayne Coppinger
"Reports are coming through from the industry regarding an increase in the number of mortgage applications that are being fraudulently submitted as buy-to-let cases, since the more stringent affordability checks in the Mortgage Market Review rules came into action.

Applications are being identified where borrowers have requested a buy-to-let loan, with the intention of actually living in the newly purchased property.   This is a clear breach of the spirit of buy to let lending, and is a “fraud for property”, since this route is often used to buy properties which would not be regarded as affordable to the applicant when treated as a residential purchase.

While this currently appears to affect a relatively small number of cases, it is clear that this approach is being used to avoid the more meticulous MMR affordability checks. The FCA is alive to the risk, and during the summer, issued a warning to lenders to be more aware of this potential practice.

Some lenders apply similar affordability criteria for BTL cases as for residential mortgages and are therefore relatively immune to this kind of fraud, but for those who primarily rely on rental income to adjudge a loan’s suitability, there are definite risks that they are left open to this kind of “fraud for property”.

As part of our partnership with two lender clients, this risk was identified alongside their risk and fraud teams, and was shared with our technical team. The resulting risk mitigation strategy – Landmark Analytics’ “Let to Live” alert, went live into the Quest Q-Guard system 12 months ago, and has already seen great success detecting and preventing this misuse of BTL lending. We are seeing volumes of alerts generated increase post- MMR – which fuels our suspicion that the FCA’s concern is well placed.


We all have a duty to make the mortgage market an unattractive fraud target, and whilst this may not be a “fraud for profit” such as property club activity, it is in all our interests that the products offered to market are used for their intended purpose so that the market remains healthy and sustainable."

To access more industry articles on this topic, also visit the Mortgage Finance Gazette website: http://www.mortgagefinancegazette.com/fraud/nipping-buy-to-let-fraud-in-the-bud/ 

Friday 12 September 2014

A day in the life of.... a Legal Account Manager at Landmark

Here's a little ditty about me Allie P
And my role I do within Legal LIG
So thanks for listening to what I'm to say
I'll try to cover it as an average day

Due diligence is key to a smooth property sale
Enjoyment and value must be assured against a fail
Landmark legal provide an environmental search
To confirm no risks will knock the sale of its perch

My role is to aid my legal clients
ensuring they practice with compliance
I inform on potential contaminates, planning & flood
I attempt to teach them until it’s understood.

I do this through training via CPDs
Making learning simple & done with ease
Aiming to complete with a knowledgeable sigh
Yes its Landmark risk reports that we’ll buy

Then there's the reseller of our reports
Who assist those lawyers to cover all ‘ports
I help them with which & how to sell
Hoping with crossed fingers their clients they'll tell

To achieve the goals that I’m set
I use my gathered skills to ensure they’re met
A career in marketing, training and sales

Means lawyer, reseller, Landmark win not fail!

Author: Alison Parsons, Legal Account Manager.

Thursday 11 September 2014

A Race Through Time

As I watched Mo Farah power his way from Newcastle, through Gateshead and ultimately cross the finish line in the coastal town of South Shields at this weekend’s Bupa Great North Run, it made me wonder how the area has changed over the years. 

The region has seen rapid development in recent times, moving away from its industrialised past, and the regeneration of the area is clear to see as we watched the runners make their way along the half marathon route.   I’m sure that if the same route was followed 50 years, 100 years or even further back in time, the runners would have certainly seen a completely different ‘north east’ from what we see today.

Starting in Newcastle, the course takes in the iconic Tyne Bridge which was opened in 1928.  As runners descend down the A167(M), historic maps show us that a reservoir was located on the exact same spot as the route back in 1864 – a swimming costume would certainly have been needed for this leg of the route. 
1864 OS map and Open Street Mapping
Dodge a reservoir

Carry further along and runners may have had to hold their noses back in 1864, as the Corporation Manure Depot was located en route.   Residential housing would have made the route impassable, with Alma Street residences located on what is today the main route towards Gateshead. 

1864 OS map and Open Street Mapping
Alma Street residences would make this impassable

The main ‘Newbridge’ station was located in what today is a motorway out of the city, and this was surrounded by coal depots, unstable ground and yet more residences, which has since made way to accommodate for the main arterial route around the city.

As the runners continue through the route, approaching South Shields on the A1300, it would have become a much more ‘cross country’ affair, as much of the surrounding areas were simply farmer’s fields.   A view towards Simonside Hall would have been clearly visible – according to reports, this was the seat of Robert Wallis who opened the first shipyard in South Shields in about 1720. After his death, his second son John developed Simonside Hall in 1784, which had fine views of Jarrow Slake.  South Shields A.F.C took a lease on the estate in 1947, and the main block of the Hall was eventually demolished in about 1973 – today the site is made up of residential housing.

As we approach the finish line in South Shields on the coastal A183 road, the ‘cross county’ theme would have continued back in the 1800’s.  There were virtually no roads in place in 1858, and instead the area consisted of marsh land, quarry land, tracks and wells.

The Great North Run route would certainly have been difficult, in fact near impossible, back in the history books and it really helps to demonstrate just how the lay of the land, industry and urban development has really changed in the last century.

Andy Noble
Head of Data
Landmark Information Group

Images: Ordnance Survey © Crown copyright and/or Database Right. All rights reserved. Licence 100022432

Promap features of the week - Article 6

The sixth offering in our Promap ‘Features of the week’ blog looks at printing your map as a PDF or saving as an image.

These blog articles are run in conjunction with our free Masterclass webinars, which demonstrate the features in action.  To register for the next free webinar click here


When setting and fixing print frames there are a few points that will make the process easier:
  • Use the “Set frame” option under the print tab to set the paper size, orientation and scale for your map.
  • When choosing a paper size you will be given three options for A4:
    • A4 small - a smaller area of mapping and larger margins at the side and bottom of your page.  This is useful if you want to put more information into your footer.
    • A4 - the standard size 
    • A4 Large –reduces the margins at the side and bottom of the page to the minimum to give you a larger print area. This can mean the difference between leaving your map at A4 size or upping it to A3 to fit your print area in and increasing the cost accordingly.
  •  When using the “Setup Print Frame” dialogue box use the “Apply” option at the bottom to put your frame on to the screen and at the same time leaving the dialogue box open to make any adjustments.
  • To reposition your frame on the screen once you have set it (but before fixing it) either:
    • Put your cursor inside the frame, hold down the left click button and drag it.
    • Or alternatively left click inside it and use the cursor keys on your keyboard to move it. 
Note: Using the print button under the step 2 option will enable you to quickly apply a frame but gives you no control over the paper size , orientation of the page, scale or position of the frame.

Headers and Footers


When applying headers and footers to your map click on the “Show fonts & logos” tab to open up a separate dialogue box. This dialogue box gives you more control over your header and footer text via the font option and will also enable you to add your company logo.

Note: Your logo will need to be in .WMF format.  If it is not currently in this format, forward your logo to us at ‘tech@landmark.co.uk’and we will convert it to a .WMF file for you.

Printing Options


Under the print section you are given two options :
  • Print – produce your map as a hard copy or a PDF if you have PDF writing software.
  • Save as Image – save your map as a Jpeg, PNG, GIF or Bitmap file.

Note: When using the Print options in Promap it will charge you for whichever you do first out of ”Printing” or “Save as image”.  You can perform the other action without incurring the full print charge again once the first charge has been accepted.

Reusing Previously Saved Print Frames


If you save your map in Promap after printing it and do not change the scale of the frame or move the frame, you can then reprint that map for the following twelve months for a very small reprint cost or no cost at all if you have an Ordnance Survey Paper Map Copying Licence.
  
If you found this Masterclass useful, keep an eye out for our next Masterclass blog which is due to be sent on the 24th September 2014. For more detailed advice on Promap why not book one of our training courses (which are all now FREE) or visit our training website by clicking here to find other useful tips and training aids.

If there are any other topics you would like to see included in the Masterclass blogs or if you have any other questions please call us on 0844 844 9965 or email us at training@promap.co.uk

Darwin’s Theory of…. The Internet of Things

In real terms, it wasn’t that long since the online world became available. In the early 1990s, all of the components were put in place which enabled what we now know as the Internet – hypertext based internets of web pages, links and web browsers. This enabled people to interconnect with each other in a way previously unimaginable, and gave widespread access to a wealth of information.

Internet technology has been consistently maturing since then, and you may now hear mention of “The Internet of Things”. At Landmark, we’re interested in technology that allows our customers to interact more effectively and gain better business value with technology, so I’ll share some fundamental details about IoT (Internet of Things).


The IoT enables communication between physical objects attached to the same network – currently estimated at six billion devices online – and creates completely new opportunities. It allows groups of interconnected systems to share information and insight so that each device in the connected system can do its job more intelligently. There has long been talk of your fridge being able to sense if you’re low on milk and order more for home delivery, and this is becoming a reality. I personally like the idea, although have a slight concern that my white goods may end up with a better social life than I do.

Landmark is proud to be ISO14001 accredited, which is the standard for environmental management. We like to see technology being used to this objective. Take the company Enlighted, for example (http://enlightedinc.com/)- they make very intelligent lighting that saves energy through only providing light where it is needed. This is nothing new, and many has been the early morning where I walk into the Landmark office to recreate Michael Jackson’s “Billy Jean” video as the lights switch on while I walk to my desk. Enlighted is extending this technology to connect with room booking systems so that the lighting can sense which rooms are not in use, regardless of their booked status.

I talked in my last Blog post about Virtual Reality (VR) and how augmented reality can be used to layer useful information over your real world view. Once this technology is extended and your VR device connects to other systems of devices, the insight and quality of information becomes exponentially more useful. For example, your futuristic car has VR built into its windscreen and you’re driving to one of Landmark’s excellent CPD Events. A few miles ahead, another car has sensed that it has stopped while on a road and, as that car is IoT connected, has automatically updated a central traffic monitor of the problem.

The traffic monitor has received similar reports from a number of cars in that specific area and uses that knowledge to deduce that there is a congestion problem. This central monitoring device, in turn, sends a message to all traffic heading in that direction, and advises of alternate routes and how busy those routes are. All displayed on your windscreen. All in real time and without any intervention from you.

Let’s think that through for a minute: less energy is wasted as a result and therefore less pollution from energy usage and production. Less time is wasted so we can be more productive. Risks of further issues from high volumes of congested traffic are greatly reduced. It’s a very effective use of technology.

Venture Capital funding into this area has been significant, so you can expect the range of IoT devices to grow in the coming months. I’ll look forward to helping our customers exploit and benefit from those new and exciting opportunities in the near future.

Darwin Lee
Head of Development
Landmark Information Group